During each volleyball match, the statistics are noted down. This makes sure that there is no discussion after the match about what happened. It is also very valuable data for coaches as it allows them to see how the offense and defense performed.

It is even possible to see what drills need to be used during training to improve certain aspects of the attack or defense of a team. It might also show that certain players need to switch positions.
A lot of coaches don’t use this data enough and prefer to work based on their feelings. Coaches that do use the data have an edge over those that don’t.
Let’s discuss in more detail what a hitting and kill percentage is.
How do you calculate kill percentage in volleyball and what is a good kill percentage?
A kill is a scored point made by a field player. This means that the ball fell in the court of the other team after an attack. This excludes serves as these are recorded separately.
It is also recorded how often the ball has been over the net (excluding serves). This is the total number of attacks and includes errors (players pushing the ball in the net). This includes tips and spikes.
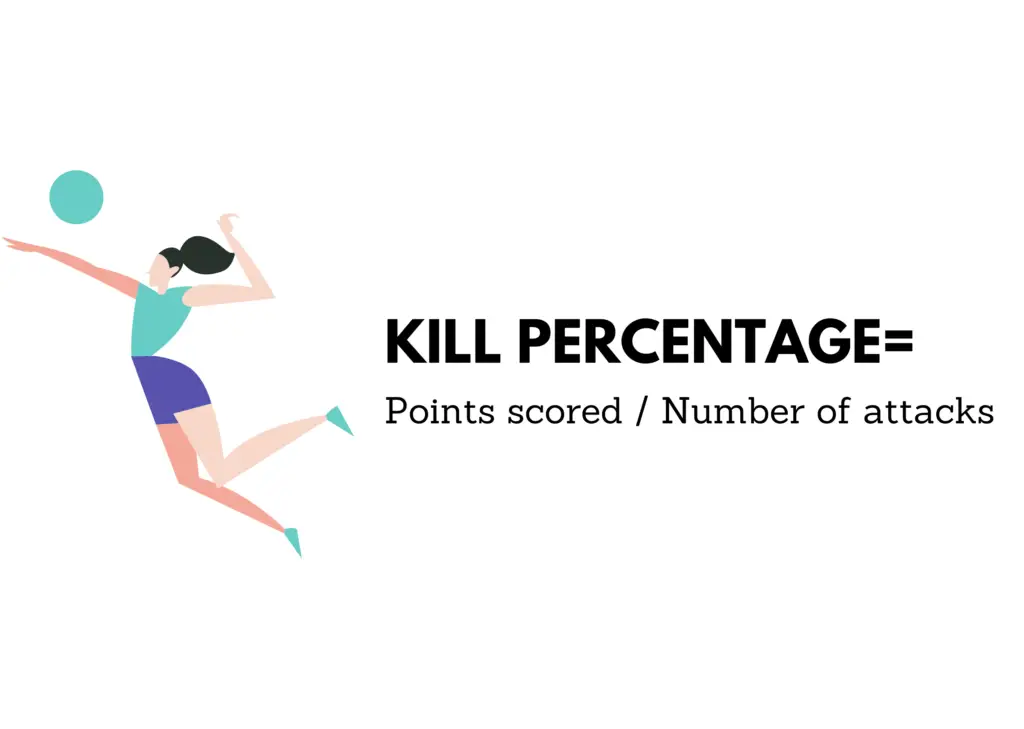
The kill percentage is then calculated by dividing the total kills by the number of attacks. This indicates how many attacks have been successful. The result is a percentage and it shows how many times a team would score if they attacked 100 times.
Since it is mainly the outside hitters and opposite hitters that will attack, it can give an indication of how effective these players are.
This kill percentage is a great tool for a coach as it is easy to calculate (just divide two numbers). It can also show trends over the season. If teams have been very effective during the first part but suddenly start to score less often, it can indicate that some players are tired or that there is an issue with the strategy or setter.
This can be calculated on a team and also player level. If one player is doing significantly worse than the whole team, it can indicate that the player is letting the team down and might be playing on a level that is too high for his or her skills. A lot of training is needed to level up their attacking skills.
Above 0.3 is considered a great kill percentage. This means that 1 in 3 attacks result in a scored point. Between 0.1 and 0.3 is considered an average kill percentage. This indicates that the player needs 10 attempts (for 0.1) to score a point or that the player scores 3 points per 10 attempts (for 0.3).
Below 0.1 is a weak kill percentage and it can indicate that the team or player must improve their attack. Every player can have an off game so it is better to look at trends in the data. The team can also affect the data of individuals as a bad pass can make it harder to score a point.
| Player name | Number of kills | Number of attacks | Kill percentage |
| Lauren Matthews | 440 | 744 | 0.48 |
Brionne Butler | 194 | 348 | 0.466 |
Rowan Ennis | 246 | 470 | 0.434 |
Below are some examples of kill percentages in the d1 competition of NCAA. As you can see, some players are significantly above 0.3 and this indicates that their attack is very efficient.
How many kills is good in a volleyball game?
It is hard to give a definite answer to this question as there are a lot of variables that have to be taken into consideration when we discuss this. This depends on the position of the player. Liberos are not going to attack as often as outside hitters or opposite hitters.

The level at which the game is being played also affects this. 8 kills per set is often seen as a great result for the main hitter. The amount of sets also affects the total kills as you have more opportunities to score. In some instances, players can get over 50 kills per match.
Given all these variables, it is often better to calculate kill percentage. Some players can have 5 kills but 20 attempts. Other players can have 1 kill out of 1 attempt. Therefore the kill percentage can give a better indication of how effective a player has been.
It is often better to look at data of multiple matches as one action can skew the result if the player doesn’t attack that often. If you look at one data point, it can be an outlier and can lead to the wrong conclusion. It can be a great idea to create a graph of the whole season to see if there were outliers or if the player or team was consistent over the whole season.
When a player is making a lot of kills, the other team can adjust their defense to defend better and make sure that the attacking players have fewer chances to score kills.
Volleyball is a team sport and if players want to spice up their statistics, they might want to attack too often themselves. This is why coaches look at kill percentages instead of just kills. It is easy to score points if you use every pass to attack. You have to make sure that your team wins by optimizing the attack.
This can only be done if you accept that other players on your team will attack from time to time as well. This can reduce your kills during a match but shouldn’t affect your overall statistics as coaches mainly pay attention to kill percentage. The main drawback of this is that players that attacked after receiving a bad set got punished as their statistics got worse while there was just a problem with the assist.
We have discussed several apps that can make it easier to track your statistics.
What is the hitting percentage in volleyball?
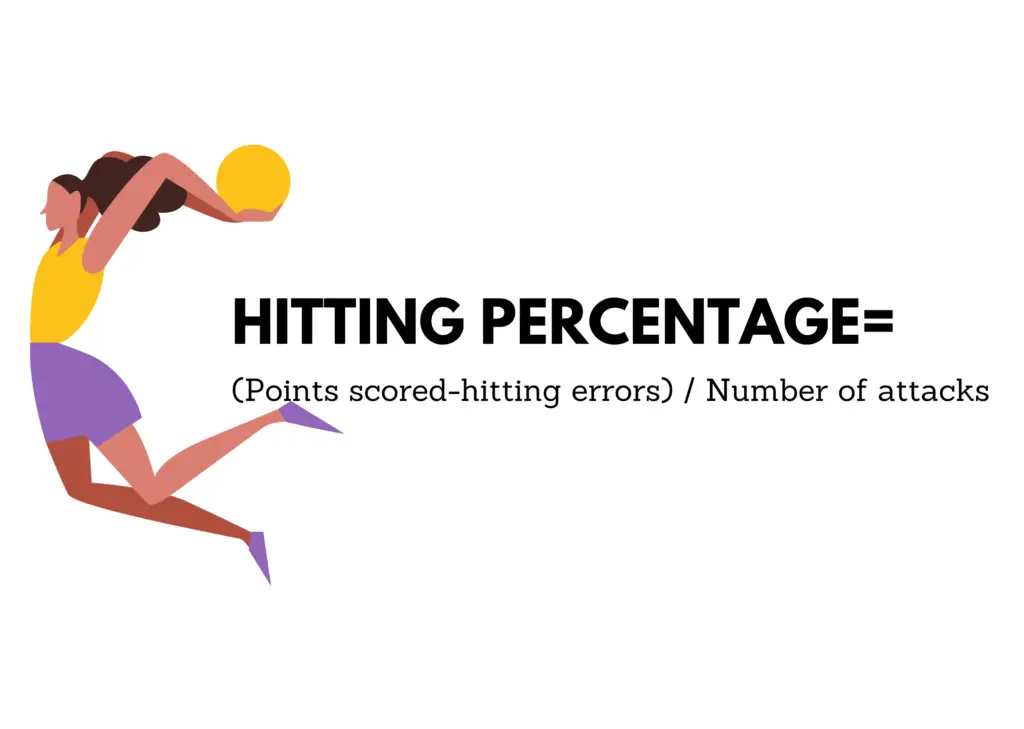
This is quite similar to the kill percentage but you subtract the amount of hitting errors from the kills. The formula is therefore as follows (kills-hitting errors)/total attempts. A hitting error is when the attacker fails to send the ball over the net (for example when they made a violation of the rules).
You still need to take a look at the amount of hitting errors as this can skew the results. This is why I like the kill percentage better as this takes hitting errors into account.
Hitting percentage can be a good metric for newer players but for advanced and professional players it is better to take the full attack into account. These experienced players shouldn’t be making too many hitting errors anyway so after a certain point this becomes less important.
This is why most coaches just look at the kill percentage and don’t spend too much time thinking about the hitting percentage as both should be in the same line. A coach will notice when a player makes a lot of hitting errors and can discuss this with the player if needed.
They don’t need statistics to be aware of this. For these reasons hitting percentage is not used that often and is less relevant. You can only focus on so many statistics and this one is redundant in my opinion.
A lot of coaches used their feeling and never looked at the data. Nowadays we see the opposite trend and some coaches focus only on statistics. Both approaches need to be combined and coaches need to listen to their feeling and also look at the data. The data can’t tell everything as the coach also needs to interpret it based on how the player performed and worked together with the rest of the team. If the hitter received bad passes from the setter, it will affect his or her kill percentage.
